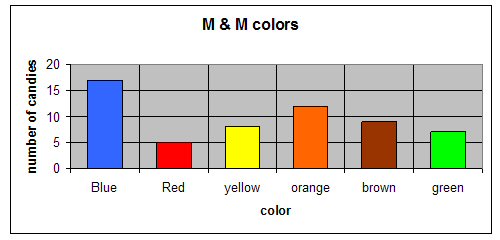
This lesson plan is for a third grade math class that will last for three days. The driving question is "What is data and how do you graph it?" The students will learn what data is and research for their own definition on iCurio. They will also learn how to graph data on a bar graph. They will be given a bag of M&M's each for them to separate the bag by colors to collect data. They will have to form a graph of the data they have collected. The students will break up into groups of three and discuss their own definition of data. In groups, they will also practice presenting their graphs to prepare to present in front of the whole class. After all the students have given their presentations they will write a reflection about themselves. The class will discuss as a whole how they thought everyone did and their likes and dislikes of the lesson.

No comments:
Post a Comment